Temperature (Land)
UAH Global Temperature Anomaly
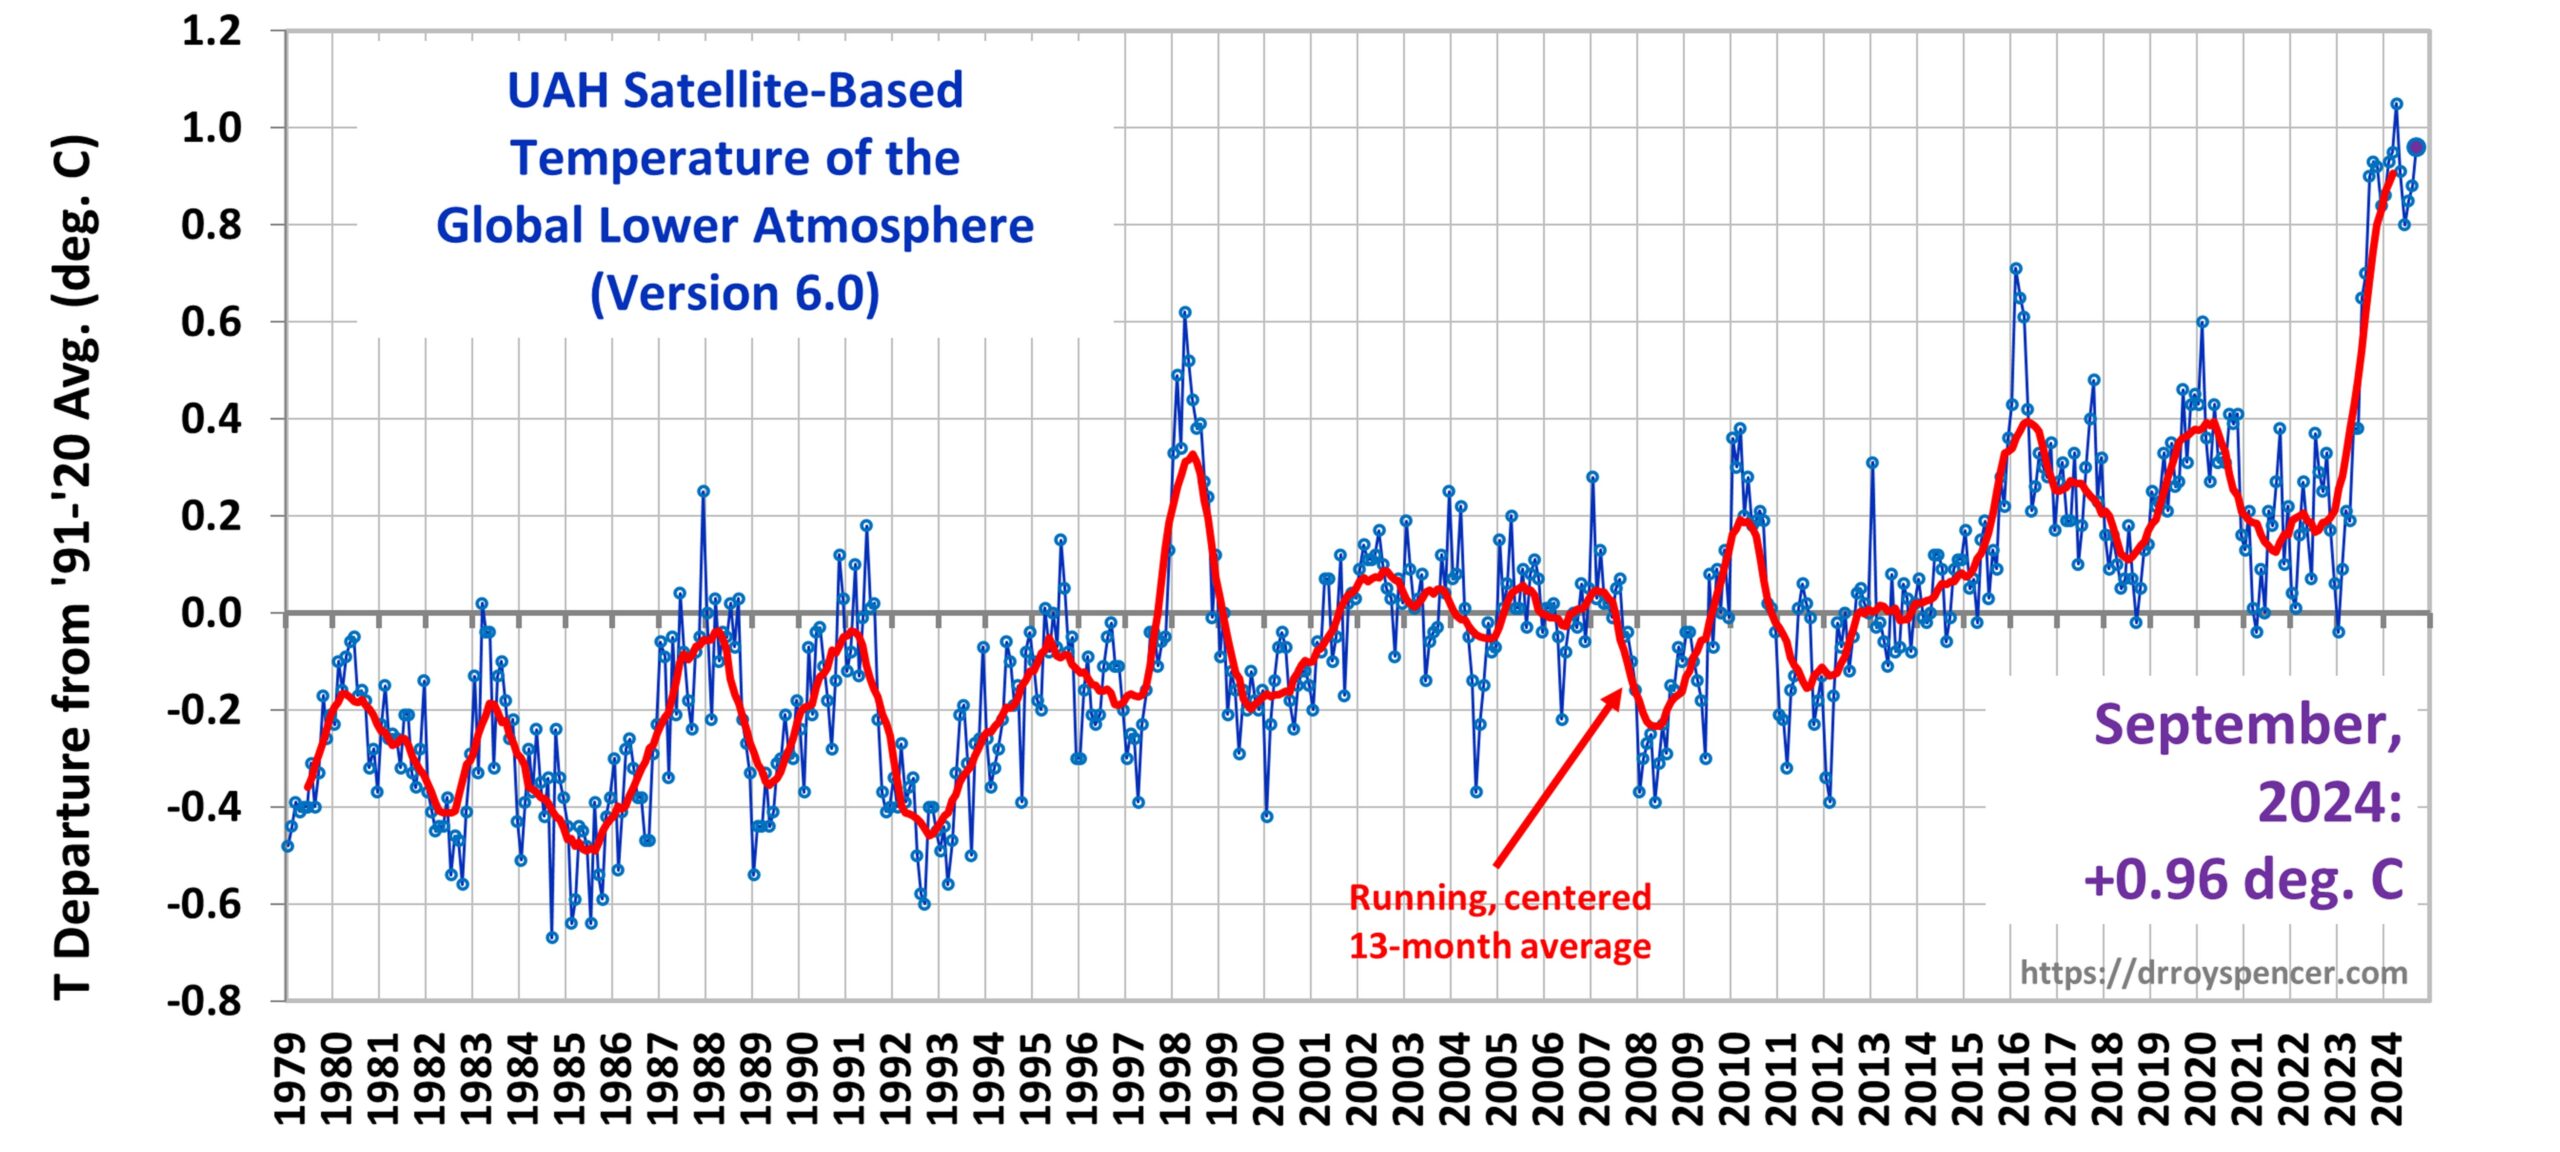
Temperature Anomaly Chart ℹ️
This chart shows monthly global temperature anomalies derived from satellite data, as calculated by the University of Alabama in Huntsville (UAH).
Daily Global 2-Meter Temperature
Global 2-Meter Temperature Chart ℹ️
This chart shows daily temperature estimates from ECMWF Reanalysis v5 (ERA5). The latest data values update with a 6-day lag from the current date.
Note that reanalysis is an approximation based on historical observational data and modeling techniques, so it should be treated as an informed guess rather than exact data.
US Temperature Anomalies (NOAA)
U.S. Temperature Anomalies ℹ️
The U.S. Climate Divisional dataset (ClimDiv) represents temperature data from climate divisions across the U.S. It uses thermometer-based 'adjusted' temperatures readings. The data closely correlates with U.S. Historical Climatology Network (USHCN) temperature.
Latest US Temperature Records (Unofficial)
Temperature Records Tracker (USA) ℹ️
Daily temperature records across the United States. The data is updated regularly and uses temperature readings from hundreds of sensors.
Temperature (Seas)
Daily Global Sea Surface Temperature
Global SST Chart ℹ️
This chart shows daily sea surface temperature (SST) estimates from NOAA OISST V2.1 data.
The latest data values update with a 6-day lag from the current date. SST data is based on observational data and modeling techniques.
Daily North Atlantic Sea Surface Temperature
North Atlantic SST Chart ℹ️
This chart shows daily North Atlantic sea surface temperature (SST) estimates from NOAA OISST V2.1 data.
The latest data values update with a 6-day lag from the current date. SST data is based on observational data and modeling techniques.
Polar Ice
Arctic Sea Ice Extent

Arctic Sea Ice Extent ℹ️
This chart presents the latest Arctic sea ice extent data compiled by NASA.
Northern Hemisphere Sea Ice Animation

Antarctic Sea Ice Extent

Antarctic Sea Ice Extent ℹ️
This chart presents the latest Antarctic sea ice extent data compiled by NASA.
Southern Hemisphere Sea Ice Animation

Arctic Sea Ice Extent (NSIDC)
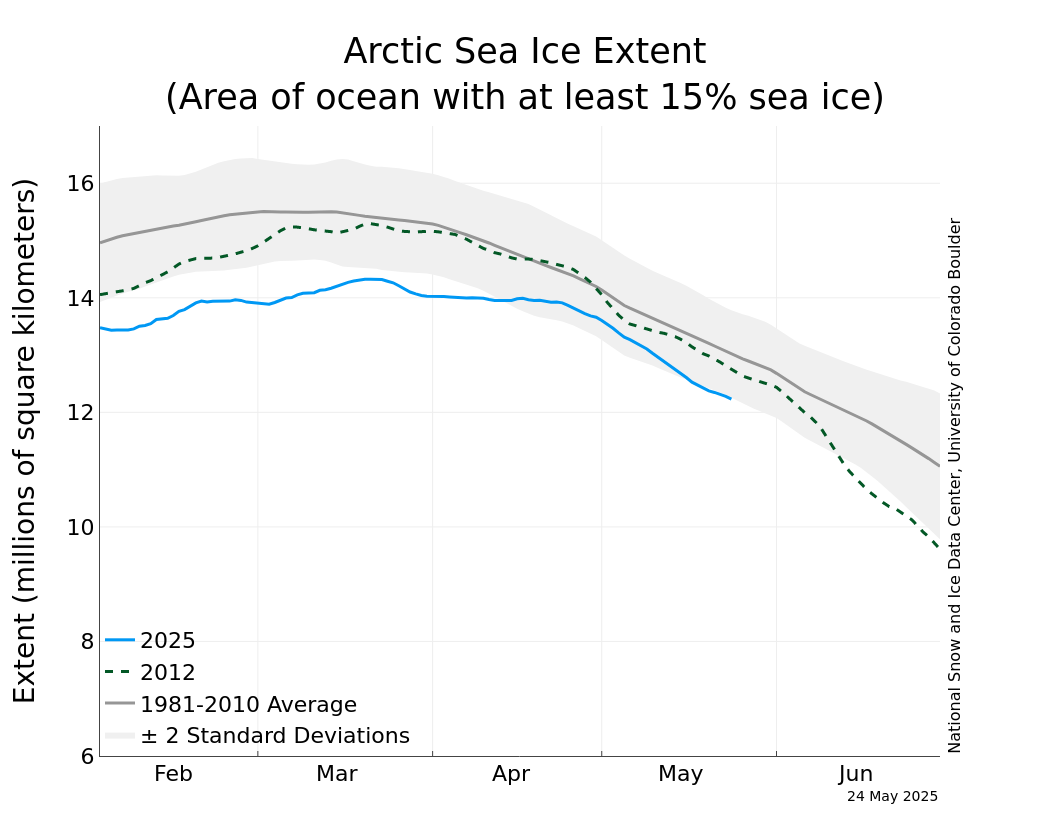
Arctic Sea Ice Extent (NSIDC) ℹ️
Changes in Arctic sea ice extent over the last four months. The 1981–2010 average is included, as is the two standard deviation range, and the year 2012.
Arctic Daily Sea Ice Extent
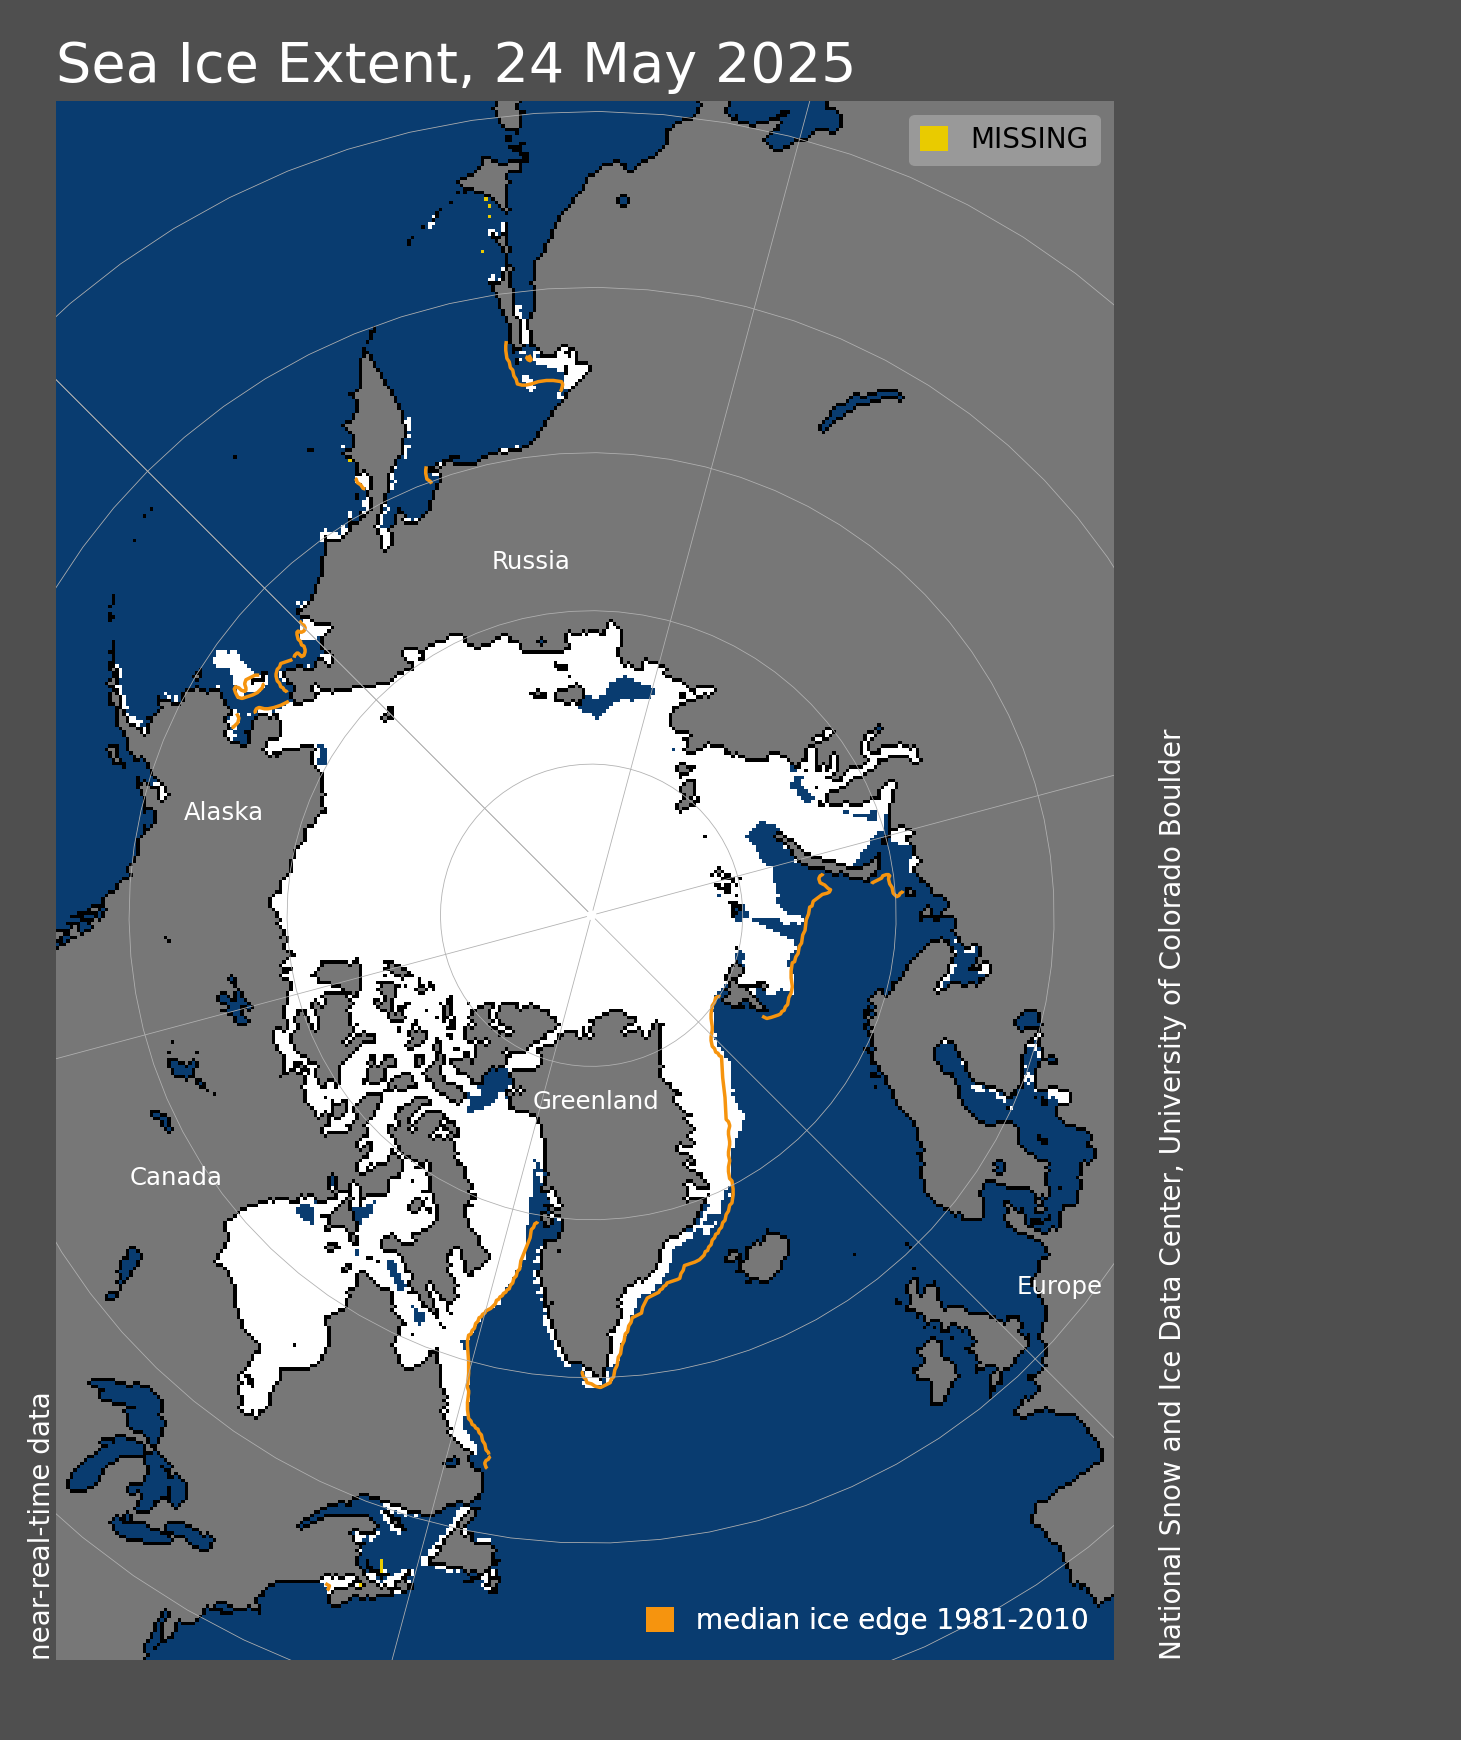
Arctic Daily Sea Ice Extent ℹ️
This chart shows daily Arctic sea ice extent, updated with the latest available data. It compares recent daily sea ice extent values with the historical average.
Antarctic Sea Ice Extent (NSIDC)
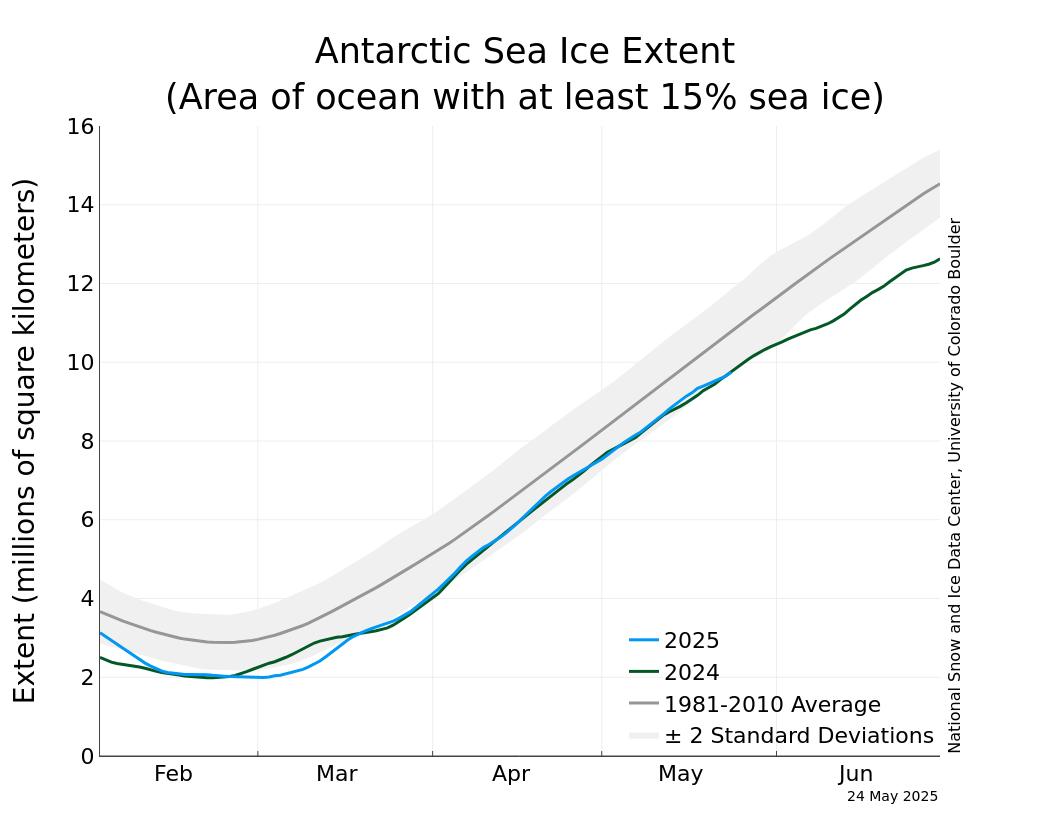
Antarctic Sea Ice Extent (NSIDC) ℹ️
Changes in Antarctic sea ice extent over the last four months. The 1981–2010 average is included, as is the two standard deviation range, and the year 2023.
Antarctic Daily Sea Ice Extent
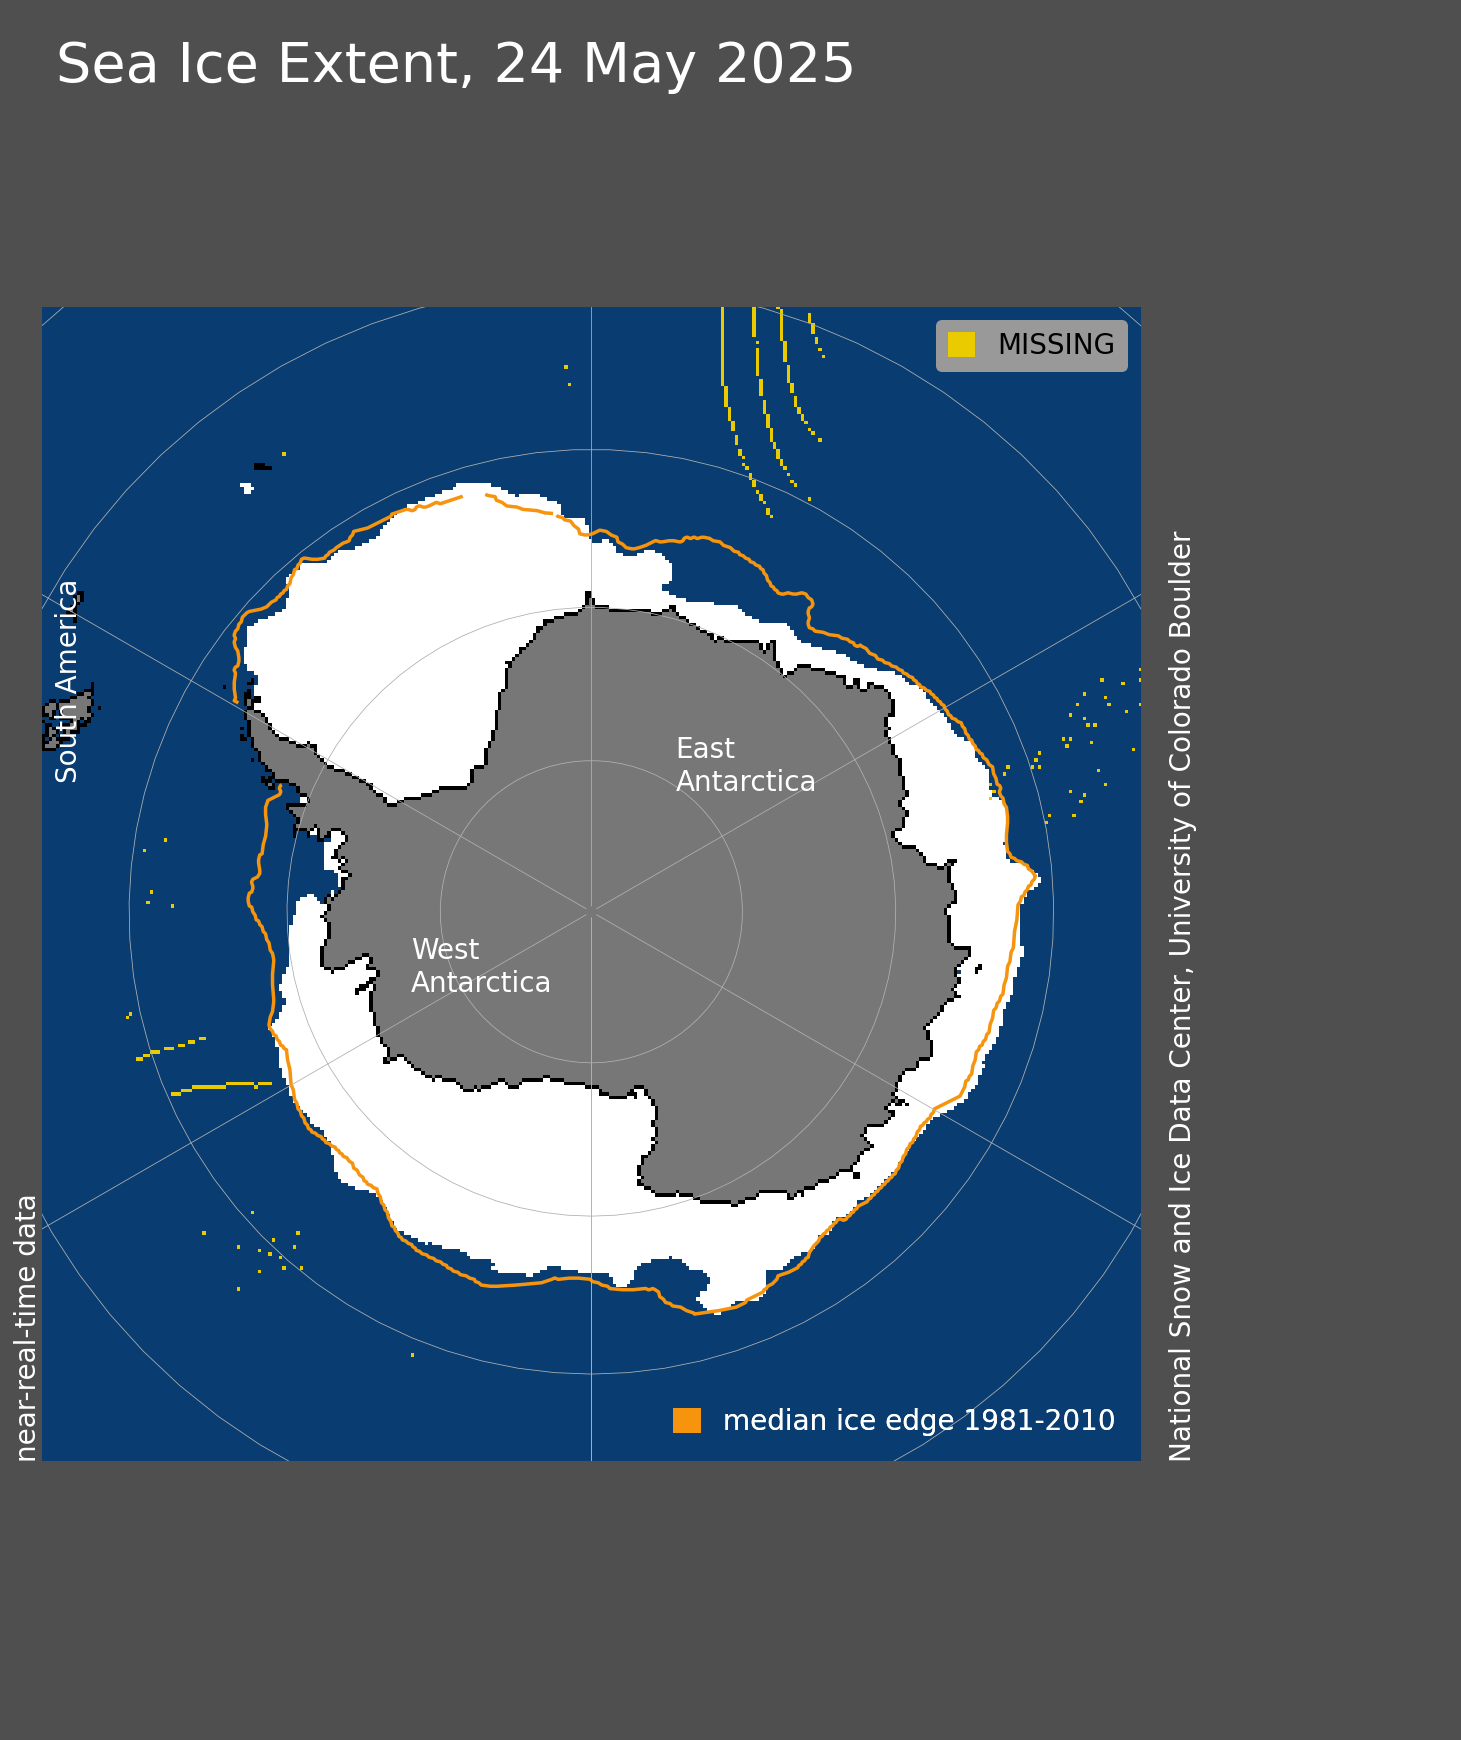
Antarctic Daily Sea Ice Extent ℹ️
This chart shows daily Antarctic sea ice extent, updated with the latest available data. It compares recent daily sea ice extent values with the historical average.
Greenland SMB
Daily SMB
SMB Daily Update (DMI) ℹ️
This image displays the daily Surface Mass Balance (SMB) of the Greenland Ice Sheet, highlighting regions of mass gain and loss.
SMB Seasonal Plotting
SMB Seasonal Plotting (DMI) ℹ️
These graphs illustrate the daily and accumulated Surface Mass Balance (SMB) over time. They compare current data with historical averages, helping to track changes in the Greenland Ice Sheet and assess long-term trends.
Snow Cover
Snow Northern Hemisphere (IMS)
Snow Extent Tracker (NH) ℹ️
This chart shows the snow extent in the Northern Hemisphere, provided by the IMS (Interactive Multisensor Snow and Ice Mapping System).
Daily Snow Extent & Departure (Rutgers)
Snow Extent and Departure ℹ️
These charts show the daily snow extent and snow extent departure from the Rutgers Snow Lab. The extent chart shows the total snow-covered area, and the departure chart shows anomalies compared to the average.
Northern Hemisphere Snow Mass (FMI)
Snow Mass Tracker (NH) ℹ️
The FMI (Finnish Meteorological Institute) Snow Mass Tracker displays the total snow mass for the Northern Hemisphere.
Northern Hemisphere Snow Extent (Rutgers)
Snow Extent Tracker (NH) ℹ️
This chart from Rutgers shows the latest snow extent coverage across the Northern Hemisphere for the current year.
Northern Hemisphere Snow Cover (CCIN)
Snow Cover Chart ℹ️
This data, updated weekly, gives us the snow cover extent across the Northern Hemisphere, courtesy of the Canadian Cryospheric Information Network (CCIN).
Northern Hemisphere SWE (CCIN)
SWE Chart ℹ️
This data, updated weekly, shows the snow water equivalent (SWE) across the Northern Hemisphere, courtesy of the Canadian Cryospheric Information Network (CCIN).
North America Snow Cover/SWE Charts (CCIN)
NA Snow Cover and SWE Charts ℹ️
These charts show the snow cover and snow water equivalent (SWE) across North America, courtesy of the CCIN.
Europe Snow Cover/SWE Charts (CCIN)
EU Snow Cover and SWE Charts ℹ️
These charts show the snow cover and snow water equivalent (SWE) for Europe (CCIN).
Daily Snow Extent South America
Snow Extent (South America) ℹ️
This chart shows the daily snow extent across South America, using multisensor data from NOAA.
Daily Snow Extent Australia & NZ
Snow Extent (Australia & NZ) ℹ️
This chart shows the daily snow extent across Australia and New Zealand, using multisensor data from NOAA.
Daily Snow Extent South Africa
Snow Extent (Southern Africa) ℹ️
This chart shows the daily snow extent across South Africa, using multisensor data from NOAA.
Daily Snow Extent Eurasia
Snow Extent (Eurasia) ℹ️
This chart shows the daily snow extent across Eurasia, using multisensor data from NOAA.
Cosmic Rays
SSW Tracker
Live Cosmic Rays Count
Cosmic Ray Count ℹ️
This chart shows live cosmic ray counts. Cosmic rays are high-energy particles originating outside the solar system, and their levels vary based on solar activity and Earth's magnetic field.
SSW Event Tracking

SSW Event Tracking ℹ️
This chart shows the zonal wind speeds at the 10 hPa level in the stratosphere above the Arctic. The data is used to track Sudden Stratospheric Warming (SSW) events, which occur when these wind patterns reverse or weaken significantly. SSW events can lead to major disruptions in the polar vortex, often resulting in unusual weather patterns, such as cold air outbreaks in the mid-latitudes.
Atmospheric Water Vapor
QBO Water Vapor
QBO Water Vapor ℹ️
This chart shows the water vapor mixing ratio in the stratosphere across different atmospheric pressure levels. While these patterns are influenced by the Quasi-Biennial Oscillation (QBO), the chart has become a key climate indicator following the unprecedented surge of atmospheric water vapor injected by the Hunga Tonga–Hunga Haʻapai submarine eruption.
Hunga Tonga Eruption
Hunga Tonga Eruption Video ℹ️
This video shows the powerful Hunga Tonga–Hunga Haʻapai submarine eruption. The eruption released a significant amount of water vapor into the atmosphere, making it a key event in climate and atmospheric studies.